ElCanut@jlai.lu to Data Is Beautiful@lemmy.ml · 2 years agoThe decline of the Simpsons 📉imagemessage-square139linkfedilinkarrow-up1712arrow-down116
arrow-up1696arrow-down1imageThe decline of the Simpsons 📉ElCanut@jlai.lu to Data Is Beautiful@lemmy.ml · 2 years agomessage-square139linkfedilink
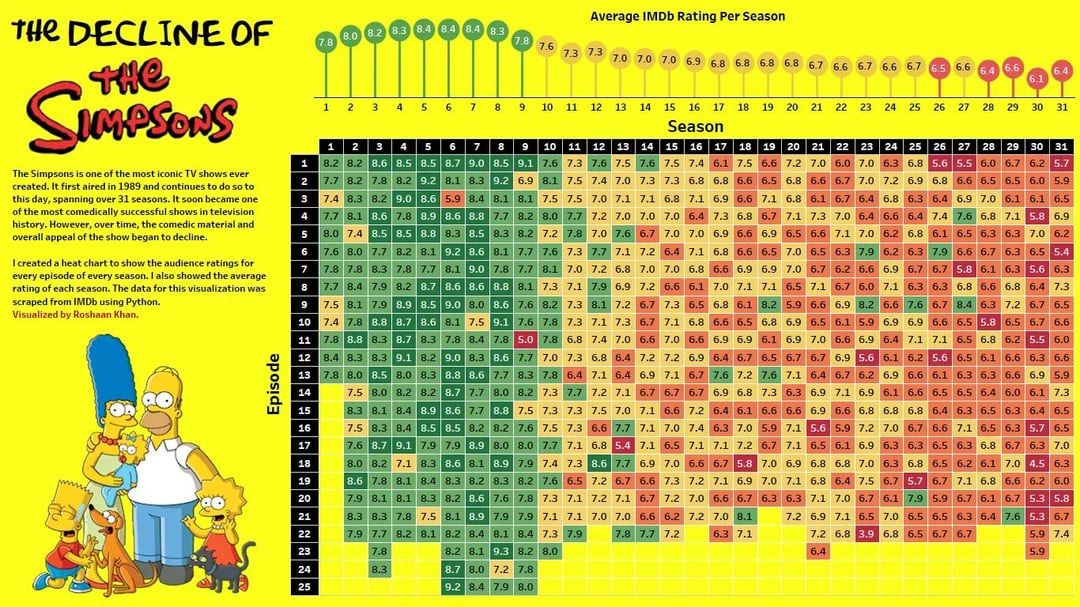
minus-squarelordmauve@programming.devlinkfedilinkarrow-up3·2 years agoI think it’s fair to colour seasons and episodes with different scales because they are measuring different things. Due to the Central Limit Theorem, average of 20+ episodes will have a smaller standard deviation than individual episodes. For example, an individual episode with a score of 6 you’ll probably watch. A whole season with a score of 6, maybe not.
I think it’s fair to colour seasons and episodes with different scales because they are measuring different things.
Due to the Central Limit Theorem, average of 20+ episodes will have a smaller standard deviation than individual episodes.
For example, an individual episode with a score of 6 you’ll probably watch. A whole season with a score of 6, maybe not.